CEERS Data Release v1.0
Full-Field Imaging and Catalog with Photometry, Photometric Redshifts, and Physical Parameters
Today we make public the latest CEERS data release! CEERS Public Data Release 1.0 includes the v1.0 reductions of the NIRCam, as described by Finkelstein et al. (2025), as well as a photometric catalog derived from the JWST NIRCam and Hubble (HST) imaging, and physical property measurements derived from SED fitting, as described in Cox et al. (2025).
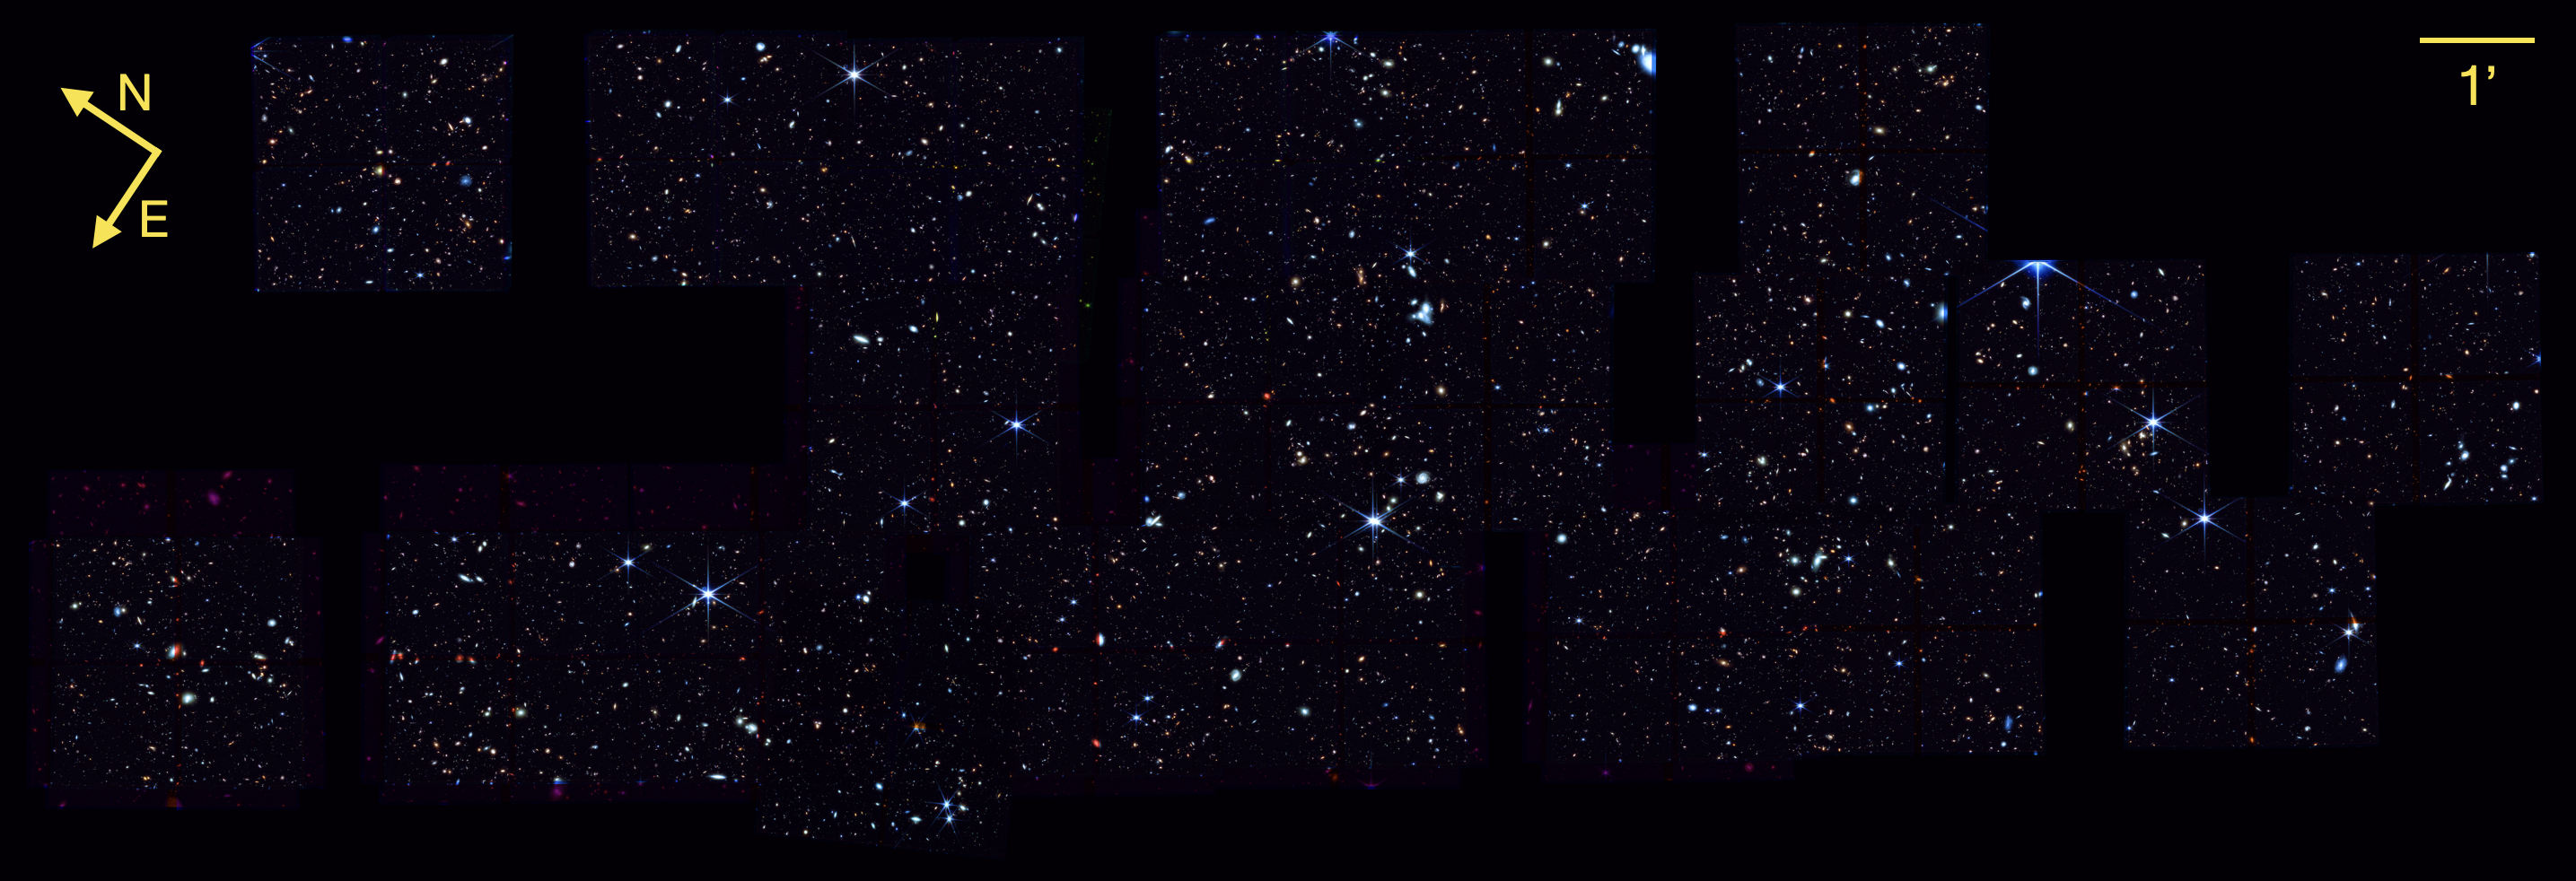
Above: A color composite (RGB) image with weighted contributions from each filter of the full CEERS (PI: Finkelstein) v1.0 mosaic, including the half-pointing from DDT program 2750 (PI: Arrabal Haro). The scale bar in the upper right indicates 1 arcmin of length. Image credit: NASA/CEERS/TACC/S. Finkelstein/M. Bagley/R. Larson. (Click here for a full resolution version of the image.)
The CEERS JWST NIRCam imaging covers the EGS field with 10 pointings of observations that occurred in June and December of 2022 (see CEERS Observing Modes for more information). Other JWST instruments, MIRI and NIRSpec, were operated in parallel with the NIRCam observations. An additional half a pointing from JWST DDT program 2750 (PI: Arrabal Haro) was also included, since it overlaps with the CEERS NIRCam pointings. We are releasing both individual NIRCam pointing mosaics as well as NIRCam mosaics of the full CEERS field. In addition to the JWST imaging, we are also releasing archival data from HST that was aligned to the same astrometry and grid as the CEERS NIRCam imaging. The reduction methods for the imaging are described by Bagley et al. (2023) and Finkelstein et al. (2025).
Using the imaging, we constructed a catalog with measurements of the light of each galaxy as well as other physical properties. We identified which sources to include in the catalog by making a detection image as a combined stack of the four intermediate-wavelength NIRCam bands. With the software Source Extractor, we fine-tuned the detection settings to make sure only real galaxies were being detected. For the galaxies we detected, we measured the photometry or amount of light in an aperture encircling each galaxy. For this photometry, we apply multiple corrections, including extinction corrections for dust along our line of sight, and aperture corrections to ensure we are measuring the total amount of light in each galaxy. There are over 80,000 galaxies in the catalog!
We also utilize the photometry from the catalog to make estimates of each galaxy's physical properties. We construct discrete spectral energy distributions (SEDs) of each galaxy, which is a plot of photometric fluxes versus wavelengths including points for each of the 14 filters in the catalog. We then use the SED modeling software, LePHARE, to estimate photometric redshifts for the sources in the catalog.
Once we had estimates for the redshifts, we ran three different SED modeling codes and input the fixed redshifts to find the physical properties of the best-fit model. These physical properties include the mass of all the stars in each galaxy (stellar mass), the rate of stars formed over a discrete length of time (star formation rate), and a measure of how much dust is affecting the galaxy. By running multiple SED modeling codes, we could compare the results, and also offer options for researchers with different science objectives.